05 10 2022. BITCOIN ANALYSIS STEPS

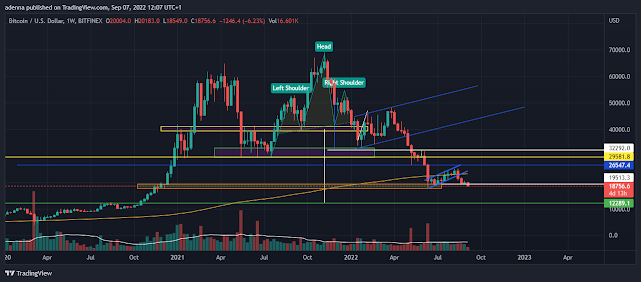
HOW TO ANALYSE BITCOIN CHARTS Some times we get so intimidated when we see a chart like this and we wonder how to analyze such a chart to know when to buy and sell. Remember that the goal of trading is to buy low and sell high consistently over time. This involves buying an assets when its at a discount. Areas of discounts are when an asset is at an over bought area, and oversold area and a pull back area. To get to know this areas on your chart you need to understand the market structure of the chart you are analyzing using leading techniques like chart patterns:(continuation and reversal patterns), candle stick patterns, wave analysis, price action (higher highs, higher lows, lower highs lower low, close of candle stick, sentiments found in the body and wick of the candle stick), support and resistance zone, demand and supply areas (swing high and swing low points). You can also use secondary graphical indicators like the volume profile, Fibonac